
结果说明
1,name表示标注名称,如上 包含两个特殊标注start和stop表示开始和结束,其次是自定义标注 marker 01 marker 02等
2,time表示当前的微秒时间
3,diff表示上一个标记到当前标记的执行时间,这个就是我们需要获取的时间差,没错,看的就是这个值。
4,total表示执行到当前的整个时间
如何使用Benchmark_Iterate类
Benchmark_Iterate类用于调试函数执行的平均时间,与Benchmark_Timer类不同在于可以多次调用同一个函数获取其执行时间的平均值,实例如下:
- require_once "Benchmark/Iterate.php";$bench = new Benchmark_Iterate;function test($i){ echo $i;}$bench->run(100,"test",10);var_dump($bench->get());
通过调用test函数100次获取平均执行时间,结果如下
- array1 => string '0.000486' (length=8)2 => string '0.000466' (length=8).............................(中间省略)99 => string '0.000479' (length=8)100 => string '0.000467' (length=8)'mean' => string '0.000476' (length=8)'iterations' => int 100
结果说明
1,每个数字表示每次调用的时间
2,mean表示函数执行的平均时间,如上调用100次test函数的平均时间为0.000476
3,iterations表示函数调用的次数
如何使用Benchmark_Profiler类
Benchmark_Profiler类用于统计函数的执行次数和执行时间等,实例如下:
- require_once 'Benchmark/Profiler.php';$profiler = new Benchmark_Profiler(TRUE);function myFunction() { global $profiler; $profiler->enterSection('myFunction'); //do something $profiler->leaveSection('myFunction'); return;}//do somethingmyFunction();//do more
结果如下
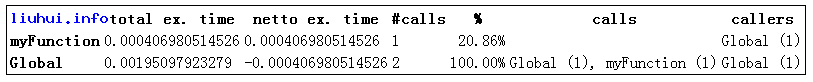
Benchmark_Profiler类在实际性能调试中使用并不多,因为还有比这个更好的工具,如xDebuger等,因此可直接忽略!
Benchmark 工具类在使用调试中针对逐行调试来分析程序性能问题非常实用,主要使用Benchmark_Timer类调试各代码段的时间点,以通过获取执行时间来优化程序提高代码的性能。这里就不再深入讨论,如果在使用的过程中有什么问题欢迎大家一起交流!
如果你发现这种逐行调试很累很辛苦,如果你想从整体上把握程序的性能情况,这个Benchmark类调试工具就不能满足你的需求,下期将讨论PHP性能调试工具xDebuger的安装与使用。
相关资料
microtime
(PHP 3, PHP 4, PHP 5)
microtime -- 返回当前 Unix 时间戳和微秒数
说明
mixed microtime ( [bool get_as_float] )
microtime() 当前 Unix 时间戳以及微秒数。本函数仅在支持 gettimeofday() 系统调用的操作系统下可用。


